In the high-stakes theater of venture capital, information is the only currency that doesn’t devalue. When an investor opens the Impact Quantum Startup Landscape, they aren’t just looking at a directory of companies; they are looking at a thermal map of global innovation. Among the various analytical lenses available, the Competitive Density & “White Space” Analysis stands out as the most vital tool for the strategic allocator. It is the difference between chasing a crowded trend and discovering a silent frontier.
To understand the power of this report, one must adopt the mindset of a “Blue Ocean” strategist. In the world of quantum technology, where timelines are long and capital requirements are astronomical, entering a “Red Ocean”—a market segment bloodied by intense competition and overlapping intellectual property—can be a terminal mistake for a startup and its backers. Conversely, identifying “white space”—geographic or functional niches where problems exist but solutions are scarce—is where the next decade’s unicorns are currently hiding.
The Geographic Pulse: From Paris to the Pacific
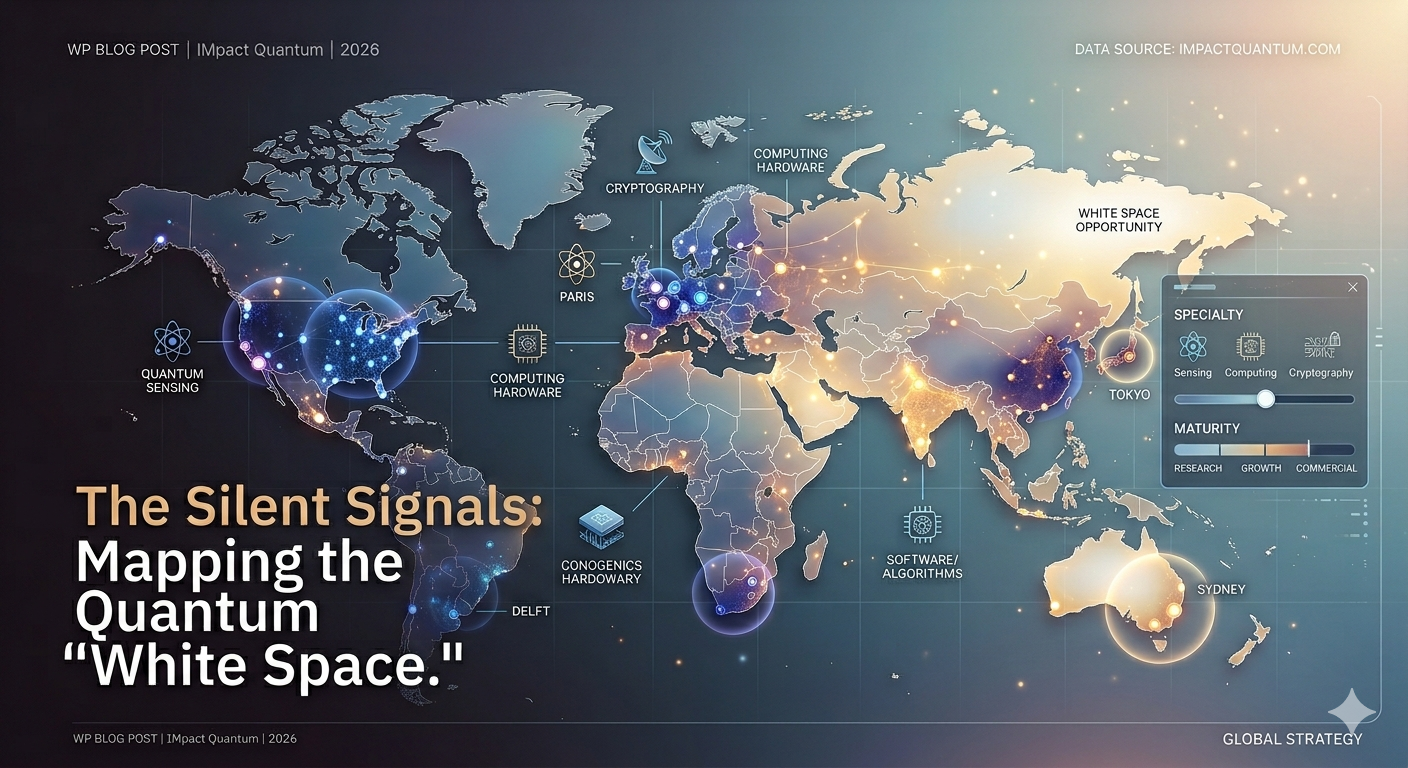
The first layer of this analysis begins with the Region filter. In the early days of Silicon Valley, geography was destiny. In the quantum era, geography is a proxy for ecosystem support. When an investor drills down into a hub like Paris, they aren’t just seeing a list of names; they are seeing the fruit of decades of French investment in photonics and theoretical physics.
A “Regional Specialization Map” reveals the “personality” of global hubs. For instance, the data might show a high concentration of Quantum Computing (Hardware) startups in the North American corridor—specifically around Boston and the Bay Area. To an investor, this suggests a “Red Ocean.” The talent wars there are fierce, valuations are inflated by proximity to Tier-1 VC firms, and the “Full Stack” approach is already a crowded bet.
However, as the investor toggles the map toward the Asia-Pacific or specific European hubs like Delft or Munich, the “White Space” begins to flicker into view. Perhaps they notice a lack of Quantum Sensing startups in North America, but a burgeoning cluster in Australia. This geographic specialization suggests that the Australian ecosystem, backed by specific government grants and mining-industry interests, has carved out a niche. For a global investor, this is a signal: if you want to bet on quantum sensing, don’t look where the noise is loudest (Silicon Valley); look where the density is concentrated in that specific specialty.
The Specialty Drill-Down: Identifying the “Picks and Shovels”
The true narrative of the quantum landscape emerges when we overlay Specialty onto these regions. This is where the “White Space” analysis becomes granular.
Consider the current state of Quantum Cryptography (QKD). An investor using the Impact Quantum tool might filter for this specialty and find that, while there are dozens of companies globally, very few are based in the Southern Hemisphere. Or, more importantly, they might find that while everyone is building “quantum hardware,” almost no one in a specific high-growth region is focusing on Cryogenic Control Electronics or Quantum Memory.
This is the “Picks and Shovels” play. During the Gold Rush, the most consistent wealth wasn’t created by the miners (the hardware startups) but by those selling the shovels (the enabling technologies). By analyzing competitive density, an investor can spot the “missing link” in a regional supply chain.
If Paris is becoming a global leader in neutral-atom quantum computing, but the “Specialty” filter shows a vacuum in specialized software compilers for that specific architecture within the EU, that vacuum is a White Space. A startup entering that gap doesn’t have to fight a hundred rivals; they simply have to fill the void. They aren’t competing; they are completing the ecosystem.
The Red Ocean Warning: Avoiding the “Me-Too” Trap
The “Red Ocean” is a place of diminishing returns. For an investor, the Impact Quantum dataset serves as an early-warning system. If the “Specialty” filter for Variational Quantum Algorithms (VQA) shows a sudden spike of 50 new startups in a single year across London and New York, the narrative changes.
In this scenario, the density indicates that the “secret” is out. The talent is diluted, and the intellectual property landscape is likely a minefield of prior art. An investor seeing this density might choose to pass on a “Me-Too” software startup, regardless of how polished the pitch deck is. They recognize that the cost of customer acquisition and the struggle for “share of mind” in a crowded specialty will eat into the startup’s capital before it reaches a Series B.
The “Regional Specialization Map” allows the investor to ask the founder: “There are 14 companies in your metro hub doing exactly what you do.” Why will you win?” If the founder isn’t aware of the density, they haven’t done their homework. The data provides the investor with the “ground truth” to challenge assumptions.
Investor Value: The Arbitrage of Information
The ultimate value of a White Space report is information arbitrage. By using the “Drill-Down” and “Compare” features, an investor can identify a specialty that is “High Maturity” but “Low Density.”
Imagine a scenario where Quantum Networking components are showing high maturity in academic papers from Singapore, but the “Startup Landscape” shows only two companies in that region. This is a massive disconnect. It suggests that the transition from lab to market hasn’t happened yet, but the ingredients are all there.
The investor who spots this “White Space” can move in before the sector becomes trendy. They can help bridge the gap between the university and the market, securing an entry valuation that is a fraction of what it will be once the “Red Ocean” players arrive two years later.
Constructing the Narrative: From Data to Deal Flow
To use this report effectively, a venture firm would likely produce a quarterly “Quantum Gap Analysis.” The narrative would read something like this:
“While the global gaze remains fixed on the race for 1,000-qubit processors in North America (a deep Red Ocean), our analysis of the Impact Quantum dataset reveals a significant White Space in Quantum-Secure Communications across Southeast Asia. Despite high regional maturity in photonics, startup density remains low. We recommend pivoting our Stage-1 search toward enabling technologies in the Singapore-Tokyo corridor to capture first-mover advantage in the quantum-safe migration market.”
This is how data becomes strategy. The map is not just a collection of pins; it is a guide to where the competition isn’t.
Conclusion: Navigating the Quantum Sea
The quantum industry is often criticized for being “all hype and no substance.” However, for the investor armed with a Competitive Density & White Space Analysis, the substance is found in the gaps.
By utilizing the Impact Quantum Startup Landscape to map specialties against regions, investors move away from “spray and pray” tactics. They stop investing in categories and start investing in positions. They find the lone sensing company in a sea of hardware or the one software firm in a region starved for applications.
In the end, the most successful investors in the quantum revolution won’t be those who followed the crowd into the Red Oceans of popular opinion. They will be the ones who used the data to sail into the quiet, lucrative White Spaces where the future was waiting to be built, undisputed and uncrowded. The report isn’t just about who is there—it’s about who isn’t there yet, and why that is the greatest opportunity of all.